Wednesday, April 25, 2018

Studying Irrigation Restrictions in Southwest Florida

Outdoor watering restrictions are one of the more common methods in Florida for curtailing irrigation. Most of the water management districts in the state recommend limiting irrigation during some portion of the year, usually during Florida’s dry season (November - April). Recently, UF-ABE alum Dr. Mackenzie Boyer published research which analyzes the effectiveness of irrigation restrictions - Water Conservation Benefits of Long-Term Residential Irrigation Restrictions in Southwest Florida. Read on for a selection of excerpts.

Dr. Mackenzie Boyer in presentation mode
Setting the Scene
Residential irrigation watering restrictions are often a standard water
conservation tool for US utilities, especially in the Southeast and
Southwest, where water resources are particularly limited and there
have been prolonged droughts. Water restrictions take various forms
throughout the United States. Most residential ordinances ban irrigating
during the hottest daytime hours (when irrigation water can be lost to
evaporation before it has a chance to be used by plants) and limit
homes to specific watering days. Some restrictions are voluntary,
while others are mandatory. Many have exceptions for newly
planted landscapes or handwatering. Despite the prevalence of water
restrictions, there is little published research on their effectiveness, and
research is generally limited to short durations or utility-wide averages

Study area in Southwest Florida
Irrigation restrictions in the Tampa Bay Water area offer a unique look into both long- and short-term restrictions as well as the behavior of individual customers. The goal of this study was to determine the effectiveness of long-term watering restrictions to reduce irrigation by individual single-family residential customers in southwest Florida. The primary objective was to compare each customer’s irrigation demand under two days/week and one day/week irrigation restrictions. Next, high, medium, low, and occasional irrigating groups were identified, and the high irrigators were mapped to determine whether there was a geographic component to irrigation behavior. Finally, the impact of a short-term ban on inground irrigation in Tampa was evaluated.


Discussion
Figures 5 and 6 show both the benefits and shortcomings of
day-of-the-week water restrictions to reduce irrigation demand. The
figures show the mean (Figure 5) and median (Figure 6) monthly
irrigation demand and irrigation required of the four groups.
It is clear from the magnitude of the irrigation demand that the high
group irrigated regularly (3.2–5.6 in./month under two days/week
restrictions), whereas the occasional group irrigated little if at all
(<0.3 in./month). Therefore, the high group had a greater potential
for conserving. Irrigation demand for high irrigators was 10.2 in./year
lower under one day/week restrictions compared with two days/week
restrictions, whereas occasional irrigators’ irrigation was 0.3 in./year
higher (Table 2). Day-of-the-week restrictions were successful in
reducing irrigation demand of the highest users, but they may also
encourage some customers to irrigate.

Mean and median irrigation demand/required
Conclusion
Long-term water restrictions that periodically reduced irrigation from
two days to one day/week during the study period of 1998 through
2010 coincided with lower irrigation demand in southwest Florida.
Annual irrigation demand was 13% lower (11.3 in./year under two
days/ week restrictions to 9.8 in./year under one day/week restrictions),
while annual irrigation required was 3% higher (25.0 in./year under
two days/week restrictions and 25.7 in./year under one day/week
restrictions) during the period of the more stringent restrictions.
Throughout the region, customers’ irrigation demand tended to be
much lower than the irrigation required, classifying the region as a
whole as one of deficit irrigators. As a group, high irrigators’
(defined as having annual irrigation demand that exceeded the
irrigation required) irrigation demand as a depth was 20% lower
under the more stringent conditions, indicating that those who
irrigated most had the most potential for conservation. Additional
conservation potential existed for high irrigators, for which the
irrigation demand was still 56% above irrigation required under
one day/week restrictions. The primary focus of this study was
long-term water restrictions, but the brief ban on irrigation in
Tampa in April and May 2009 resulted in a substantially lower
irrigation demand as well.


Acknowledgment  
The authors would like to thank the Southwest Florida Water
Management District and Tampa Bay Water for funding this research.

Wednesday, April 18, 2018

H2OSAV and Water-Use Data Visualization


We are in the age of big data. With respect to water-use, being able to access, analyze and visualize data is invaluable for both research and conservation program development. UF/IFAS State Specialized Extension Agent Dr. Nick Taylor uses data to help utilities increase water savings with H2OSAV. Dr. Taylor recently presented his work at the South Florida Water Management District Water Conservation Expo, where he agreed to an interview with IrriGator.

Dr. Nick Taylor, UF/IFAS State Specialized Extension Agent
Can you describe H20SAV?
NT: H2OSAV is a water-savings analytics and visualization tool. What we’ve done is put together a suite of software platforms that a utility can use to assess how their conservation programs have been performing in the past so they can begin to better target those programs to their customers - based on consumption patterns and property features - in a way that can help to increase overall savings. Another component of H2OSAV is data sharing between utilities about programs - how they perform, how to make them better and how to move forward to reach their savings goals.


Can you talk about how a data hub like H2OSAV can be useful for research?
NT: Well there’s the obvious data component - data availability, being able to merge and match that data with property appraisal and other open sources of data. In the past I’ve worked with a number of students of researchers from all over the country to gain access to utility data. And what we get is a group of collaborators who can start to evaluate research questions, maybe add ideas about how that data handling works well or not so well. That’s on the academic side.


On the county level we do have extension agents using this platform. Even though the primary data source has to come from the utility, in several instances the extension agent for the county is also using this. Alachua County is a prime example. Gainesville Regional Utilities has this service and both Alachua County EPD and the Alachua County extension agent use it. It’s very similar in Sarasota and hopefully we’ll be talking with other utilities we work with about access to those platforms for the extension agents there.


Right now is H2OSAV mostly focused around the Central Florida Water Initiative (CFWI) area?
NT: Yes. Part of the reason it’s focused there is that the state DEP is very concerned about that region. They have directed our attention to that region. We have good collaborators in that region and they have a very set goal that they need to reach. It’s very critical at this time. We’re certainly willing to branch out, but it gives us a contained area to really focus on.
Where is H2OSAV in its development? Is this something that is ready to be applied anywhere or are you still working on refining/perfecting?
NT: It has been deployed. There are utilities that are using it. It’s also under constant development where we have production versions, development versions and then we roll out updates, much the same as you would get an update to an app on your phone, or any sort of software.


Currently we have three software tools and they will be merged eventually into one tool that can do many many things. The bar is going to be set high in the future. We have a lot more work to do. What I really want to see is better collaboration between the utilities and that’s the main goal. If there is a next phase, or next step, we want to see some proof that this tool is actually helping and reducing water use.

Wednesday, April 11, 2018

Plot Study Comparing Different Irrigation Technologies For Turfgrass

By Kati Migliaccio

From 2015 to 2017, a plot study was conducted in Gainesville, FL, during the growing season. A weather station at the plot site collected weather data and water meters recorded the amount of water applied to each plot. Plots contained established Bermudagrass and were irrigated with four quarter-circle pop-up spray heads.


Figure 1. Picture of turfgrass plots at University of Florida.

Treatments
Eleven different irrigation technologies were used to schedule irrigation: time-based treatment without a rain sensor (WOS), time-based with a rain sensor (WRS), time-based with a rain sensor and a 60% deficit (DWRS), Smartirrigation turf app (APP), Smartirrigation turf app with seasonal water conservation (APPSWC), Baseline soil water sensor (BAS), Rain Bird soil water sensor (RBD), Toro soil water sensor (TOR), Hunter Solar Sync ET (ETH), Rainbird ESP SMTe (ETR), and Weathermatic ET (ETW).


Figure 2. Data collection at the turf plots at the University of Florida Agricultural and Biological Engineering Department (Bernard Cardenas-Laihacar and Ian Hahus pictured)

Results
Results showed that all irrigation scheduling method tested produced water savings as compared to WOS treatment. Average water savings for the soil water sensors ranged from 50 to 61%, for the ET controllers ranged from 19 to 62%, and for the Smartirrigation apps 51 to 64%.

In this plot study, we investigated the use of the seasonal water conservation feature in the Smartirrigation Turf app (APPSWC) where irrigation schedules were provided at a 25% deficit if rainfall exceeded evapotranspiration (ET) the five previous days. This strategy helps reduce irrigation when rainfall is expected to occur and to contribute to plant water needs. During the three years of the study, adding the seasonal water conservation component to the APP schedule resulted in additional water savings. The average water savings over the three years as compared to the WOR treatments for the APP and APPSWC were 51% and 64%, respectively.

During year 2017, a modification was made to the soil water sensor treatments where irrigation was split between two events, a morning and afternoon event. Interestingly, this strategy resulted in only 20% or less events of full irrigation for the three treatments (Fig. 3)

Figure 3. The percent of irrigation events that were full irrigation (pink), percent of irrigation events that were half (green), and percent of irrigation events that were interrupted (gray) for 2017 soil water based sensor treatments

Useful Add-ons
Our results suggest that coupling an irrigation technology with another scheduling feature, such as split irrigation events or irrigation deficits, provide for additional water savings without impacting turf quality. These two add-on features would be useful to implement in locations where rainfall significantly contributes to plant water needs.

For more information on using technology for scheduling irrigation - contact Dr. Kati Migliaccio or Dr. Michael Dukes from the Agricultural and Biological Engineering Department. Additional information is also available in the UF/IFAS EDIS system.


Wednesday, April 4, 2018

Three Questions About Smart Irrigation Technology

April is Water Conservation Month in Florida. A large part of using water efficiently day to day includes outdoor water-use. Next week UF-ABE Professor and Extension Specialist Dr. Michael Dukes is participating in an irrigation technology training in collaboration with Tampa Bay Water and Florida Irrigation Society. Dr. Dukes’ team is usually involved in several of these technology trainings every year. To mark the initial event of 2018, he agreed to answer three preview questions for IrriGator.

Register
What is exciting right now in the world of smart irrigation technology?
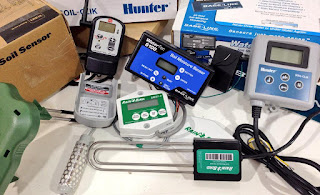
MD: There are many options. There are over 800 models of weather-based (evapotranspiration, ET) controllers that have the EPA WaterSense label. Soil moisture sensor (SMS) based controllers don’t yet have a label but there are several of those on the market as well. Exciting new developments are that many ET controllers have remote connectivity. Some are completely controlled by your smartphone. These devices offer many features. Unfortunately, most haven’t been tested in Florida and I understand from field reports that not all are adapted to our climate with intense local rainfall. We always recommend some sort of on-site rain sensor such as an expanding disk rain sensor.


I often find practicioners view weather-based and soil sensor-based irrigation technology as rival options. How do you address this perspective?   
MD: They can be seen this way, but each have their place. I believe the advantage of the SMS is that it integrates rainfall to control the system. Not all ET systems do this well (see previous comment). On the other hand for a one sensor SMS system, the location of the SMS is critical since it controls whether the system irrigates or not.


Your group does several trainings like this during the year, what can an attendee expect at the April event?
MD: We’ll review how smart controllers work, both ET and SMS, and why water conservation is important, and some things to be aware of on how to properly install these devices. We’ll also introduce other types of conservation devices such as pressure regulating spray heads, check valves and flow reduction - technologies such as pressure regulation that aren’t new but in the case of pressure regulation a new EPA WaterSense label is available. We are relying on vendors to present hands-on for their particular products.